Tuesday, September 21, 2010

Australia: RBA Minutes - Higher interest rates would be required if growth continues


 The RBA have just released their latest minutes, and as expected some hawkish comments were seen. 

The RBA commented that the inflation pressure coming from the increase in investment that leads to a rise in the resources utilization, will probably need higher interest rates to ensure inflation remained consistent with the medium-term target.

"The central scenario remained for the Australian economy to grow at trend pace, or a bit above, over the next few years. This forecast incorporated quite a subdued outlook for the main G7 economies and around trend growth in Asia", the Reserve Bank of Australia said.

While the bank remains alert to risks such as weaker global growth, "members considered that if the central scenario came to pass it was likely that higher interest rates would be required, at some point, to ensure that inflation remained consistent with the medium-term target". 

RBA Meeting's Minutes

Sep 21
01:30
-
Consensus

Stumble
Delicious
Technorati
Twitter
Digg
Facebook
Reddit

UK's Public Sector Net Borrowing soars


National Statistics relase of public sector finances revealed that the United Kingdom's Public Secotr Net Borrowing rose to an astonishing £15.302Bn in August. 


The previous data was revised down to reflect a net borrowing of £1.991Bn in July. Although a rise in borrowing was expected, forecast anticipated it to be capped by £12.2Bn.

Public Sector Net Borrowing

£15.302B
Actual
£12.200B
Consensus

Stumble
Delicious
Technorati
Twitter
Digg
Facebook
Reddit

Friday, September 17, 2010

Gold bullion sets new all-time high above $1280


The gold bullion continues to soar on Friday, as global foreign exchange rate policy tensions as well as US dollar weakness make the precious metal attractive as an alternative investment. In early trading over Europe, the gold contract for December delivery has set a new record high in $1284.40 a troy ounce, nearly $8.00 from the opening price.

Despite a slightly improved risk appetite by the end of Thursday with US equities finishing the day in positive territory, the gold bullion remains strong as exchange rate tensions multiply. The US Treasury Secretary Tim Geithner yesterday testified against Chinese exchange rate policies, stating the yuan has not been allowed to appreciate quickly enough. Consequently speculation is spreading through the market of competitive depreciation, only a few days after the BoJ intervened in their own foreign currency market in order to counter the strength of the yen.

Stumble
Delicious
Technorati
Twitter
Digg
Facebook
Reddit

Swiss Interest Rates unchanged


Beyond even almost the slightest bit of uncertainty, the Swiss National Bank decided to maintain the current stand of Interest Rates at 0.25%, just as forecasted. 

The central bank's release states: "Uncertainty about the future outlook for the global economy remains high. Economic recovery is not yet sustainable. Downside risks predominate. Should they materialise and result in a renewed threat of deflation, the SNB would take the measures necessary to ensure price stability."

SNB Interest Rate Decision

0.25%
Actual
0.25%
Consensus

Stumble
Delicious
Technorati
Twitter
Digg
Facebook
Reddit

Tuesday, September 14, 2010

Make The Currency Cross Your Boss


In the stock market, a trader has the opportunity to choose from more than 5,000 companies - hundreds of which will rally in the most vicious of bear markets and thousands of which will crash during the strongest of bull runs. But in the currency market, such divergent possibilities do not seem to exist. In this article, we'll look at how forex traders can use currency crosses to make a wide variety of trades that are unaffected by the day-to-day fluctuations of the greenback. 
  
All Currency Bets Are the Same 
When dealing in the major currency pairs, most traders are presented with only one choice: dollar bull or dollar bear? Regardless of whether a trader is long the GBP/USD (British pound-U.S. dollar) or the EUR/USD (euro-dollar), or short the USD/CHF (dollar-Swiss franc) or USD/JPY (dollar-Japanese yen), the unifying theme in all of these positions is that the trader is bearish on the greenback. Therefore, the question of which of the four trades should be taken is immaterial, since all of them will likely be profitable if the dollar is weak and all will lose money if the dollar is strong. 

Granted, this may sound like a gross oversimplification of the forex market. We'll be the first to acknowledge that some currencies can and do challenge this paradigm - the Canadian dollar is one good recent example of such a dynamic. Buoyed by skyrocketing oil prices, the loonie has turned into a petrocurrency as Canada has become the United States' No.1 supplier of crude. As a result, while other major currencies like the euro, the yen and the pound have recently declined against the U.S. dollar, the Canadian dollar has gained in value. However, this is an exception that proves the rule.  

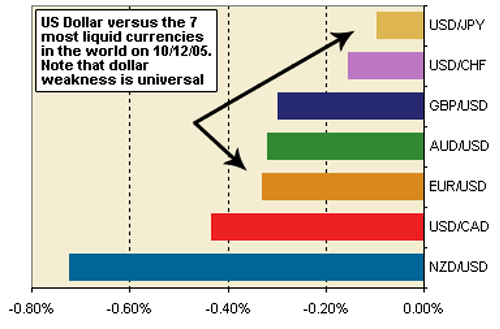
To better understand how this works, let's take a look at the two charts below. Figure 1 looks at the performance of the seven most liquid currency pairs in forex, composed of the four majors: 
  • EUR/USD
  • USD/JPY
  • GBP/USD
  • USD/CHF
and the three commodity pairs: 
  • USD/CAD
  • AUD/USD
  • NZD/USD
Figure 1 looks at activity on a single trading day - October 12, 2005. To normalize the data, we converted every pair so that its performance could be analyzed accurately. Typically, if the dollar were weak, the EUR/USD would rise and the USD/CHF would decline; however, in Figure 1 we have made the adjustment so that the returns are consistent vis a vis the dollar.
Figure 1: In forex, some currency pairs are quoted in terms of the U.S. dollar (e.g. EUR/USD), while others are not (e.g. USD/CHF). By inverting the pairs that are not expressed in terms of the dollar, we can compare the strength/weakness of each pair relative to the dollar.
Source: DailyFX.com
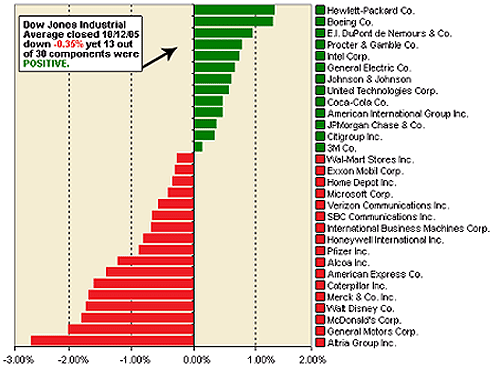
Figure 2 looks at activity on the same trading day - October 12, 2005 - for the Dow Jones Industrial Average.
Figure 2: In FX, most traders (those trading the seven most liquid currency pairs) are presented with only one choice - dollar bull or dollar bear - but the stock market is less straightforward. As this chart shows, even when an index like the DJIA is down overall, many of its stocks can be up, making it harder to take a purely bearish or bullish outlook.
Source: DowJones.com
 
Both of these charts clearly illustrate that while the stock market is truly a market of stocks, the currency market is really a market of dollars and anti-dollars. The central reason why this is so is that the dollar serves as the reserve currency for the world's central banks. Therefore, when speculators are bullish on the dollar, capital will flow from all the major currencies into the greenback and vice versa when the sentiment reverses. 

Crosses Offer More Possibilities 
If you look closely at Figure 1, however, you'll notice that the capital flows are far from uniform. Some currencies appreciate substantially against the dollar, while others gain barely a few basis points. This difference in performance against the greenback creates profit opportunities for market players who choose to trade in currency crosses. Crosses are simply a measure of the relative strength of an individual currency against the dollar. Crosses are distinguished by the fact that they do not include the dollar as either the numerator or the denominator of the pair. As such, they offer traders a tremendous opportunity to make far more nuanced bets in the currency market than the simple pro- or anti-dollar trade. 

What makes crosses especially interesting to currency traders is the fact that they can provide much cleaner trend or range signals which will be unaffected by the day-to-day oscillations of the greenback. 

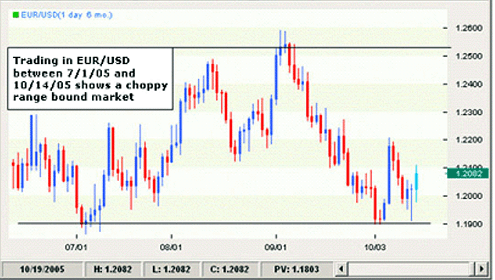
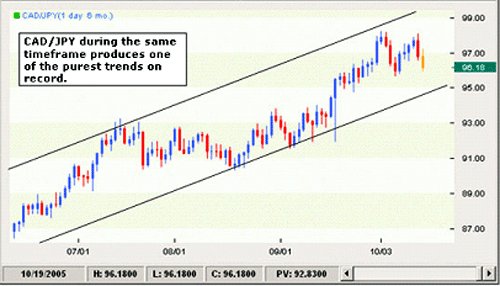
To better understand how crosses work, let's examine the following two charts, which look at data over the same period of time (from July 1, 2005 to October 14, 2005). While the most liquid financial instrument in the world - the EUR/USD - has done nothing but range aimlessly during the period in question, frustrating both bulls and bears (see Fig. 3), the CAD/JPY has displayed one of the purest trends in recent memory, gaining almost 1,000 points without any material retracement (see Fig. 4).

Figure 3: The EUR/USD has traveled between support and resistance, making it very frustrating for bulls and bears alike.
Source: FXTrek
 

Figure 4: Traders of currency crosses were able to profit from the prolonged uptrend of the CAD/JPY.
Source: FXTrek
Why did the CAD/JPY rally? As we mentioned earlier, the Canadian dollar is a petrocurrency that has received a tremendous boost from the stratospheric rise in the price of crude. The yen, on the other hand, is the principal victim of high oil prices because it is the only highly industrialized country in the world that must rely on imports for 99.5% of its petroleum needs. The CAD/JPY, therefore has an 89% correlation with the price of oil. 

Canny traders who bet on an oil rally could have expressed that opinion very effectively in the currency market through a long CAD/JPY position. Even better, they would have harnessed a positive yield differential in the process. With the loonie currently yielding 2.75%, while the yen rates remain at 0%, the interest rate differential alone was 275 basis points or 27.5% annualized using a standard 10:1 leverage factor. (This essentially means that since FX traders can use $1 of capital to control $10 worth of currency, the gain from the 275 basis point differential will be 10 times larger than if traders did not use leverage.) 

Carry or Capital Gains 
Crosses can be as volatile as the most heavily-traded stocks during the heyday of the Nasdaq bubble or as sedate as a 'AAA'-rated dividend-yielding utility share on the NYSE. Trading in crosses can focus on carry strategies that try to profit from interest rate differentials between the currencies or it can be focused on pure capital gains speculation. Trades can also be based on economic analysis or political news. Some crosses can trend for months, while others will be highly range-bound. In short, the possibilities with currency crosses are endless. Let's look at the charts below to see some examples of recent trades in the crosses that demonstrate these ideas. 

The Carry Trade 
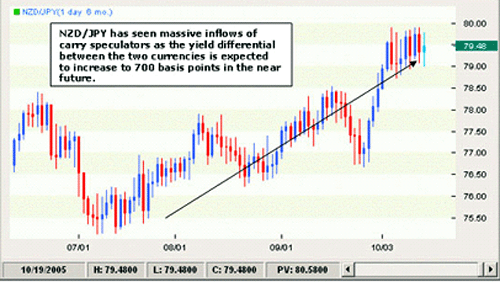
One of the most popular trades in foreign exchange is the carry tradewhich involves going long a high-yielding currency against a low-yielding one. Looking at the seven most liquid crosses in the world, no pair has shown a greater interest rate differential than the NZD/JPY pair. In mid-October 2005, the New Zealand dollar, nicknamed the "kiwi", yielded 6.75% (the Reserve Bank of New Zealand subsequently increased that rate to 7% at the end of October). The Japanese yen., on the other hand, yielded 0% (as of October 2005), and the Bank of Japan's zero interest rate monetary policy is expected to remain in effect until all vestiges of deflation are gone from the Japanese economy. The spread between the currencies was a whopping 675 basis points, and as a result, carry trade speculators plowed into the cross, increasing its value by 400 pips between July and October 2005. 

Figure 5: The NZD/JPY pair gained momentum in the three months shown here in response to widespread speculation that the NZD rate would increase to 7% in Nov 2005. Carry trade speculators plowed into the cross in order to gain exposure to this higher rate differential, causing the NZD/JPY to increase in value
Source: FXTrek

The Political Trade 
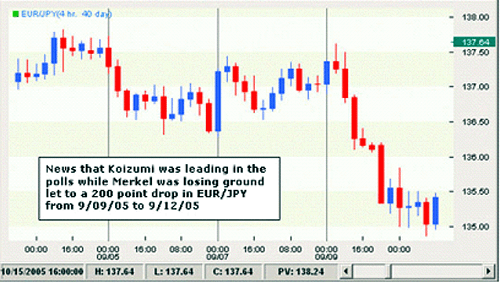
In mid-September 2005, both Japan and Germany had elections. In Japan, Prime Minister Junichiro Koizumi ran on a reform agenda that called for the privatization of the Japanese postal service, a quasi-banking institution with $3 trillion in deposits and 25,000 branches. InGermany, the reform-minded candidate Angela Merkel ran against the standing Chancellor Gerhard Schroeder. While Koizumi's message resonated well with the Japanese voters as he headed to an overwhelming win, Merkel's victory over Schroeder was hard-fought - the two contenders were locked in a struggle for leadership for more than a month after the German elections were initially held. In September 2005, therefore, the EUR/JPY cross presented a tremendous profit opportunity as a de facto "Koizumi/Schroeder spread". Indeed, from September 9 to September 12, the cross tumbled nearly 200 points as traders bid up the yen and shorted the euro as a response to the election results. 


Figure 6: The chart above shows the weakness in the euro which could be attributed in part to the uncertainty over the outcome of the German elections. FX traders were more inclined to place their money in the Japanese yen, because the political situation in Japan was more certain
Source: FXTrek
The Economic Trade 
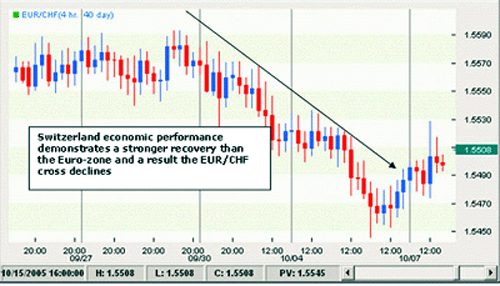
Consistent disparities in economic performance can sometimes offer very profitable trades in the crosses. A case in point is the price action in the second half of 2005 in the EUR/CHF currency cross. The massive declines in the two currencies during the first half of 2005 were beneficial for both the euro zone and Switzerland since both regions are heavy exporters and both generate substantial trade surpluses. However, the smaller and more nimbleSwitzerland did not suffer from the political and institutional disarray that pervaded the euro zone after the rejection of the EU Constitution in the summer of 2005. With much better unemployment numbers (3.8% in Switzerland vs. 9.9% in EU) and faster growing retail sales (4.7% vs. 0.9%), Switzerland was clearly outperforming its much larger neighbor next door. As the realization of this fact began to permeate the market, the EUR/CHF cross (one of the least volatile crosses in the market) declined by over 100 points in the period between late September and early October 2005 shown in Figure 7. 


Figure 7: The cross shown here illustrates Switzerland's resilience to the economic and political hardships that were happening in the euro zone
Source: FXTrek

The Volatility Trade 
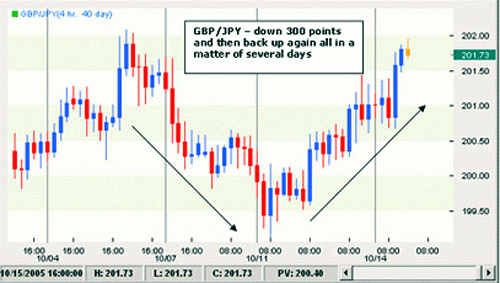
If you are a trader who likes volatility and lots of it, nothing provides more action than the GBP/JPY cross. Trading this cross is akin to trading a volatile technology stock; it often moves several hundred points in a day. One of the key reasons for such wild price action is that GBP/JPY is also a very popular carry trade. With U.K. rates at 4.50% in October 2005 and Japan's rates at 0%, the interest rate differential was 450 basis points. 

A slowdown in the U.K. economy caused the Bank of England to lower rates by 25 basis points in September 2005, and with the market highly uncertain of whether this was a one-off move or a hint of more rate cuts to come, trading in the GBP/JPY looked set to be especially turbulent, thus providing volatility-seeking traders with plenty of opportunities. 


Figure 8: There are currency crosses to suit all types of traders. This chart shows the GBP/JPY, which is one of the most volatile crosses.
Source: FXTrek

Conclusion 
The examples discussed here should give you a sense of the variety of trades that are possible using cross currencies in the FX market. Typically, 90% of all trading by volume in forex takes place across the four major currency pairs. However, for traders willing to step out of the crowd and explore a different path, trading in currency crosses can provide a multitude of profitable opportunities and should become a standard part of any FX trader's arsenal of ideas.

Stumble
Delicious
Technorati
Twitter
Digg
Facebook
Reddit

Goodman’s Swing Count System


"You Can Figure the Markets, but You Can’t Figure the Human Race"

Historical Perspective
The Principles of Goodman’s Swing Count System were informally set forth in a series of annotated commodity charts from the late 1940’s to the early 1970’s. These trading studies simply titled ‘My System’ were the work of Charles B. Goodman and were never published.
I met Charles Goodman at the Denver, Colorado offices of Peavey and Company (later, Gelderman) in the fall of 1971. It was the occasion of my maiden voyage in the great sea of commodity trading (later, futures). In 1971 silver prices were finally forging ahead to the $2.00/ounce level. A 10-cent limit move in soybeans elicited a full afternoon of post-mortems by traders and brokers alike.
The Peavey office, managed by the late and great Pete Rednor employed eight brokers (later, account representatives). The broker for both Mr. Goodman and I was the colorful - and patient - Ken Malo. Brokers, resident professional traders - including Mr. Goodman and the Feldman brothers, Stu and Reef - and a regular contingent of retail customers drew inspiration from a Trans-Lux ticker that wormed its way across a long, narrow library table in the back of the office. Most impressive was a large clacker board quote system covering almost the entire front office wall. This electro-mechanical quotation behemoth made loud clacking sounds (thus its name) each time an individual price flipped over to reveal an updated quote. Green and red lights flashed, denoting daily new highs and lows. Pete, apart from being an excellent office manager was also a fine showman using the various stimuli to encourage trading activity!
Almost everyone made frequent reference to Charlie’s huge bar charts posted on 2 ½ by 4-foot sheets of graph paper, mounted on heavy particle board and displayed on large easels. No one ever really knew what the numerous right-hand brackets ( ]) of varying lengths scattered throughout each chart meant. But there was always a great deal of speculation! The present work finally reveals the meaning of those mysterious trading hieroglyphics.
The quiet chatter of the tickertape, the load clacking of the quote board, the constant ringing of the telephones. The news ticker that buzzed once for standing reports, twice for opinions and three times for ‘hot news’, the squawk boxes and Pete Rednor’s authoritative voice booming, ‘Merc!, Merc!". What a spectacular scene it was! No wonder that this author, then a 21-year old trading Newbie would soon make commodity futures and currency trading his life’s work.
But nothing made a greater impression on me than the work of Charles B. Goodman. He instilled first, some very simple ideas: "Avoid volatile markets when at all possible" - "Trade only high percentage short term ‘ducks’ " - "Sit on your hands, Dad, sit on your hands". It didn’t take long for me to adopt the ultra-conservative ‘Belgian Dentist’ style of trading, that is - "Avoiding losing trades is more important than finding winning trades"
The Belgian Dentist approach carried with me when I developed my famous AI trading system in the 1980’s - Jonathan’s Wave. Even though it generated 48% annual returns with a zero expectation of a 50% drawdown (according to Managed Account Reports) it drove the brokers berserk because it could easily go a full month without making a single trade!
Charlie’s trading advice, I am certain, allowed me to survive the financial Baptism of Fire that destroys most commodity and currency trading Newbies in a matter of months, if not weeks.
Mr. Goodman was to be my one and only trading mentor. Over the decade that followed he entrusted to me many, if not most of his trading secrets. To the best of my knowledge he shared this information on his work with no one else in such detail.
Charlie and I spent hundreds of hours together analyzing the trade studies from My System. We also analyzed hundreds of other commodity, currency and securities charts. Charlie was happy with My System being ‘organized’ in his mind. But as a new generation technical analyst, I was anxious to see it formalized on paper and eventually in source code on a computer. (To be honest this created a small amount of friction between the two of us - Charlie was dead set against formalized systems and believed strongly in the psychological and money management elements of trading.) Notwithstanding, by 1979 I was finally ready and able to formally state the principles of My System. Because of its equal concern for price measurements (parameters) and price levels interacting together (matrices) I originally renamed My System ‘ParaMatrix’. My first investment management company in the mid-1970’s was ParaMatrix Investment Management and I acted as both a registered Investment Advisor (SEC) and Commodity Trading Advisor (CFTC).
Contrary to ongoing speculation, only two copies of my original 1979 ‘Principles of ParaMatrix’ ever existed. I possess both of them. Charlie’s original My System trade studies were mistakenly destroyed shortly after his death in 1984. What remains of them are the 200 or so examples I copied into Principles of ParaMatrix.
The present work, Goodman’s Swing Count System (GSCS), is a reorganized re-issue of Principles of ParaMatrix with updated charts and a simplified nomenclature that I am sure Charlie would have appreciated; "Keep it simple, Dad!" he would always advise. I’ve also expanded on Charlie’s ideas by ‘filling in’ some less formed ideas such as his market notation, or calculus as he referred to it, and a method for charting which I have dubbed Goodman Charting.
Two of Charlie’s less well-defined ideas are NOT included in this work: 1) Dependent/Scaled Interfacing and 2) Time-Based (cyclical) measurements. There are also a number of intra-swing formations I have not discussed.
My own direction in futures and currencies turned in the 1980’s to artificial intelligence (Jonathan’s Wave) and in the 1990’s and today, artificial life and cellular automata (The Trend Machine). In spite of, or perhaps because of these complicated ‘cutting edge’ computer efforts I continue to view Goodman’s Swing Count System (GSCS) in a very positive light. To this day, the first thing I do when I see any chart is a quick Goodman analysis!
GSCS is a natural ‘system’ for pursuing the conservative Belgian Dentist approach to trading, even without the aid of a computer. This article, in fact, could be used to make Goodman analysis without a computer at all! But it is in fact intended as an introduction to the CommTools Analytic Suite GSCS software. That software is intended as a supplemental tool only for doing Goodman chart analysis.
GSCS trade opportunities are as frequent today (perhaps more frequent) than they were 40 or 50 years ago. I believe the system’s foundations have well stood the test of time. Patterns today are no different than they were decades ago - nor are the twin human emotions - Fear and Greed - that create them. GSCS is an excellent method for finding support and resistance areas that no other method spots, and for locating potential turning points in any market. One of its best suits - it can easily integrate into other trading techniques and methodologies.
I would never recommend or advise anyone to use a 100% mechanical trading system, GSCS or any other!
Is it really a ‘system’? Depending upon your perspective GSCS is between 70% and 90% mechanical. The program available from CommTools, Inc (www.commtools.com) represents the kernel idea of mechanizing perhaps 80% of the system. I now believe attempting to completely code Charlie’s work would be inadvisable.
Mr. Goodman passed away in 1984. It was always his desire to share with others - although as is usually the case with true genius - few wanted to listen. These days we are ever more bombarded ever more cryptic and computer-dependent software programs and ‘black-boxes’. Perhaps now is the time for the simple yet theoretically well-grounded ideas of GSCS to populate.
The publication of this brief work and the GSCS software, I hope and pray, would meet with Charlie’s wishes. His work in extracting an objective and almost geometrically precise (ala Spinoza) trading system out of a simple trading rule (the ‘50% rule’) is most remarkable. It has certainly earned him the right to be included in the elite group of early scientific traders including Taylor, Elliot, Gann and Pugh.
Conforming to the spirit of the original My System, I’ve attempted to keep theoretical discussions and formulations to a necessary minimum. Trade studies in Part 3 of this article must still be considered the crux of GSCS, even though I am pleased with the formalization of most relevant principles in Part 2. The trader weary of theoretical discussions and intrigue will find all the concepts and principles delineated in the trade study examples. Nevertheless, those who invest time in the theory of GSCS will undoubtedly discover an area for further exploration where many new and fresh ideas are waiting to be mined.
In Mr. Goodman’s worldly absence, the responsibility for this work and its contents is solely mine, for better or for worse.
Theoretical Overview and Definitions
The cornerstone of GSCS is the age-old ‘50 Percent Retracement and Measured Move’ rule. This rule, familiar to most traders goes back almost as far as the organized markets themselves. It has been traced to the times when insiders manipulated railroad stocks in the 19th Century.
DIAGRAM 1-1: The 50 Percent Retracement and Measured Move Rule
The first systematic description of THE RULE was given in Burton Pugh’s The Great Wheat Secret. This book was originally published in 1933. In 1973, Charles L. Lindsay published Trident. This book did much - some say too much! - to quantify and mathematically describe THE RULE. Nevertheless, must reading for anyone interested in this area of market methodology. Edward L. Dobson wrote The Trading Rule That Can Make You Rich in 1978. This is a good work with some nice examples. But none of these, in my humble opinion, even scratch the surface, relative to Goodman’s work.
In 1975 a well-know Chicago grain floor trader, Eugene Nofri, published The Congestion Phase System. This small but power-packed volume detailed a short term trading method using simple but effective ‘congestion phases’. While not precisely a work on THE RULE it touched - from a different perspective - some of Charlie’s ideas.
Diagram 1-2: A Congestion Phase
[I mention Nofri’s work also because Charlie was especially taken by its simplicity and because it can work well in conjunction with GCSC. The idea of melding GCSC with a congestion phase approach ought to produce a method of finding those high percentage ‘ducks’ that the Belgian Dentist so much loves! Charlie also felt that Hadady’s work on Contrary Opinion was a natural ‘fit’ especially since the GCSC support and resistance points seldom lie where anyone else thinks they should.]
Still, in the end, it was left for Charles B. Goodman, the great grain trader from Eads, Colorado to extract all the logical consequences from THE RULE and transform it into a robust, almost geometrically precise system.
The logic of THE RULE is quite simple. At a 50% retracement, both buyers and sellers of the previous trend (Up or Down) are ceteris paribus ‘in balance’. Half of each holds profits and half of each holds losses.
Diagram 1-3: A Market Tug of War
The equilibrium is a tenuous one, indeed. The distribution of buyers and sellers over the initial price trend or swing is obviously not perfectly even: Some buyers hold more contracts than other buyers. They have also different propensities for taking profits or losses. Nor does it account for the buyers and sellers who have entered the market before the initial swing or during the reaction swing. Not all of the buyers and sellers from the original swing may be in the market any longer.
Remarkably, GCSC eventually takes all of this into account - especially they buyers and sellers at other price swing levels, called matrices.
Nevertheless, the 50% retracement point IS often a powerful and very real point of equilibrium and certainly a ‘known and defined hot spot’ of which one should be aware. Remember both the futures markets and the currency markets are very close to a zero-sum game’. It is only commissions, pips and slippage that keep them from being zero-sum. At the 50% point it doesn’t take much to shift the balance of power for that particular swing matrix.
THE RULE also states the final (3rd) swing of the move - back in the direction of the initial swing - will equal the value of the initial swing. The logic of this idea, called the ‘measured move’ is seen in the following diagram. At the ‘D’ point one side (in this case the buyers) have won and the sellers are ‘wiped out.’
Diagram 1-4: The Measured Move and ‘Unwinding’
As we have alluded to examples of THE RULE occur at ALL price levels or matrices and many are being ‘worked’ simultaneously in any given ongoing market. This is a critical point. In modern terminology it would be said that price movements are ‘recursive’. Simply stated this means that without labeling you could not really tell the difference between a 10-minute chart and a daily or weekly chart - they all exhibit the same behavior and operate under the same principles of Parameter and Matrix.
The bar graphs below were taken from actual market data. It is functionally impossible to tell apart the time units, with respect to the chart action.
Diagram 1-5: The Markets are Recursive
Now we can begin to informally define SIX of the SEVEN CONCEPTS in THE RULE that Mr. Goodman used to construct GCSC. What had been neglected by previous theorists, users, writers and purveyors of THE RULE was this:
The 50% point is indeed an equilibrium point. As such, the equilibrium must ‘give way’ BUT EITHER SIDE (buyers or sellers) in either a downtrend or an uptrend may prevail at any given matrix or price level.
Goodman realized both the possibilities for a REVERSAL (as in the case of the completed measured move) and a PRICE SURGE. A price surge would be the equivalent to the sellers (in an uptrend) and the buyers (in a downtrend) winning the tug of war within a matrix. In price action this means prices would fall or rise to at least the beginning point of the initial swing!
Diagram 1-6: Price Surge - The FIRST Concept
In other words - the measured move is not a done deal - the 50% retracement (Diagram 1-1a) could also become a ‘V’ or inverted ‘V’ as in the next diagram. The 50% retracement is not a reversal point (necessarily) but should be considered as a ‘point of interest’ where prices may be more likely than randomly to decide whether to continue or reverse.
It may not sound like much, but it is a major discovery.
Clearly price surges are implicit in THE RULE. But they are not visible on a chart unless you are looking for them and unless you are considering the 50% retracement as a ‘point of interest’ and not necessarily a reversal. In fact, most practitioners perceive a price surge as a failure of THE RULE!
Even more importantly, Goodman discovered the implications of THE RULE occurring simultaneously at all price levels. I remember EXACTLY the day and place when Charlie showed me this one - it hit me as truly a grand revelation on the markets!
Diagram 1-7: THE RULE at Multiple Levels (Matrices) of Operation - The SECOND Concept
Here you are: The initial (primary) trend and secondary (reaction trend) as well as reversals (measured moves) and surges are relative to price matrix context. What is one thing in one price matrix may well be its opposite in a higher (or lower) matrix.
(It’s true - Elliot Wave Theory contains the same concept. But with GCSC you can tell BEFORE (in many instances) which it is. In Elliot you can only tell AFTER. GCSC is a predictive system, while Elliot - grand and elegant as it is - is primarily a descriptive system.)
All Price Matrices (levels) - in theory - are part of a larger price matrix,
All Price Matrices composed of smaller price matrices
Of course there is the practical limitation of the smallest possible fluctuation.
Besides Reversals and Surges GCSC matrix concepts include Domination and Generation.
Clearly prices do not always seem to find any kind of equilibrium at the 50% retracement price area. Or, so it may seem. This leads to the third Grand discovery:
The extent a price swing overshoots or undershoots its ideal 50% retracement that price value will be ‘made up’ on the next price swing within the matrix.
Now THIS is the trading rule that can make you rich!
For example, if prices fall only 40% of the initial trend and reverse, the measured move will actually be either 90% or 110% of the measured move point and value of the primary (initial swing in the matrix. The 10% difference - GCSC holds - MUST be made up eventually. This is the concept of Compensation.
Diagram 1-8: Examples of Compensation within a Matrix - The THIRD Concept
Furthermore: If the difference is not fully made up in the final price swing of a matrix the cumulative ‘miss’ value will carry over through each price subsequent price matrix until it does. This is the concept of Carry Over. A ‘carryover’ table is used to add and subtract cumulative carry over values until they cancel.
Diagram 1-9 Carry Over - The FOURTH Concept
When no Carry Over remains, the price matrix is said to have ‘cleared’ or ‘cancelled’. This is the GCSC concept of Cancellation. Cancellation is critical to finding GCSC support and resistance points and other chart ‘hot spots’ where something much less than random is likely to occur.
Diagram 1-10: Cancellation - The FIFTH Concept
The exact method for these important concepts is more fully described in this article, Part 2.
We can now get an early glimpse of what the strange brackets on Charlie’s charts were all about.
Diagram 1-11: Meaning of the Brackets Revealed
Charlie had even more ideas:
The importance of a ‘hot spot’ in relationship to its likelihood of being an important point of support or resistance, reversal or continuation, increased when two or more price matrices cancel at the same price or same price area. This is the key concept of Intersection. There is no analogous concept in Elliot, the most common ‘competitor’ to GSCS. Intersection makes GSCS much more objective and testable than other swing systems.
Diagram 1-12: Intersections - The SIXTH Concept
This article has covered micro formations. Charlie also had compiled a dozen or so extremely valuable macro formations - combinations of micros.
I encourage the reader to examine some charts and find simple areas of the intersection of two (or three) matrices. You will see at once that these points are GOLDEN to the trader. If I had, after 30 years of studying the markets one idea to impart it would be to show you an example of a GSCS intersection in 2 or 3 matrices.
Remember, Carry Over is to the same or NEXT larger price matrix. The above are examples of Independent Intersections. That is, each price level Carry Over calculation is kept separate from the others and ‘tallied’ at the end of each matrix. Charlie had also developed (much less precisely) a concept of Dependent Intersections but it is quite complex, beyond the scope of this article and worth of further codification into software at a future date.

Stumble
Delicious
Technorati
Twitter
Digg
Facebook
Reddit

TRADING: A MIND GAME


You must change your mental attitude first from a normal person to that of a speculator. Almost all traders I have met, except a few successful ones who really made millions and billions trading in the market, simply waste all their time trying to learn the easiest part in perfection, like about how to read data and charts, and trying to perfect entry and exit skills, etc. Trading is a mind game and without having a right frame of mind, it is a losing game even before it starts. Training a trader�s mind is the first step for any successful trader but almost all new traders neglect that part and that explains why more than 95% of traders are a failure in the long run.
Acquiring the knowledge of the market is not difficult for anyone with average intelligence after a few years of hard study in the market. But it is neither the level of intelligence nor the knowledge that decides the outcome of the market operations of a trader. It is the decision making process that is so hard for most traders to overcome and that is the main reason for a success or a failure for all the traders. Some find it easy to make decisions and stick to it and most find it so hard to make decisions and stick to it. Unfortunately, any decision making process in trading is a pain-taking process and humans tend to avoid pains and go for pleasures even if for temporary ones. Assuming one has acquired enough market knowledge and acquired one�s proven trading system (this is the second most important element of success in trading, in fact. An edge in any system is based on the quality of info one has, charts being only an info of secondary quality not the best one)
Through studies and research, a trader faces the task of making decisions to put this knowledge and system into practice. Then, how many traders can honestly say they can commit their ranch when the trade is suggested by their own system (given that trading is just a chance game) and let the profit run for weeks and months when their system tells them, and how many can manage to cut the loss as a routine process when the situation arise. It all sounds so easy when saying it but so difficult when doing it affecting real money in the market. I still do not sleep well when I am running position because even if the profits are running into a few hundred dollars and the system is telling you to carry on, there is no guarantee that the profit will turn into a yard or two in a month time, and it may even turn into a loss in a day or two when something unexpected happens. A painstaking process in real sense. The pain is not knowing what will happen in the future and in fear of losing. So at the end of the day, assuming one has decent trading system and market knowledge and decent info, it is ultimately how disciplined and how well that trader can take the pain of making right decisions at the right time that decides the outcome of the trades. Hence I call trading a mind game. When I interview prospective young traders, I always look for disciplined and strong-willed person as my first priority as long as one has decent education, but strangely in many cases, it is some kind of genius or half-genius with lots of brains with no disciplines who turn up for an interview thinking only bright people can make good traders.
In fact, I always try to pyramid while position trading medium-term once I am convinced of a new medium-term trend emerging. Like in USD/JPY position trading 135-132 as an initial position, adding in 132 and 129 areas. Same for AUD/USD and EUR/USD with similar strategies. But sitting on positions and watching the counter-rallies costing truck load of money is not easy job to do and causes lots of pain all the time. Most traders even among experienced ones cannot bear that pain and give up too early. But there is no other way to make a big money and we have to bite the bullet and "sit and accumulate" as long as the medium-term trend is intact. That is why I always believe psychological aspects of trading is far more important than anything else in successful trading. A mind game like those bluffing game of poker.
Entries and exits can never be "irrelevant" for any trader for any purpose. It is just that psychological aspects of trading are much more important than entries and exits, and decisive for the success or failure of a trader in the long run. Perhaps exits are more important than entries because any perfect or near-perfect entries are possible only in hindsight.

Stumble
Delicious
Technorati
Twitter
Digg
Facebook
Reddit

Essential Elements of a Successful Trader


Courage Under Stressful Conditions When the Outcome is Uncertain
All the foreign exchange trading knowledge in the world is not going to help, unless you have the nerve to buy and sell currencies and put your money at risk. As with the lottery “You gotta be in it to win it”. Trust me when I say that the simple task of hitting the buy or sell key is extremely difficult to do when your own real money is put at risk.
You will feel anxiety, even fear. Here lies the moment of truth. Do you have the courage to be afraid and act anyway? When a fireman runs into a burning building I assume he is afraid but he does it anyway and achieves the desired result. Unless you can overcome or accept your fear and do it anyway, you will not be a successful trader.
However, once you learn to control your fear, it gets easier and easier and in time there is no fear. The opposite reaction can become an issue – you’re overconfident and not focused enough on the risk you're taking.
Both the inability to initiate a trade, or close a losing trade can create serious psychological issues for a trader going forward. By calling attention to these potential stumbling blocks beforehand, you can properly prepare prior to your first real trade and develop good trading habits from day one.
Start by analyzing yourself. Are you the type of person that can control their emotions and flawlessly execute trades, oftentimes under extremely stressful conditions? Are you the type of person who’s overconfident and prone to take more risk than they should? Before your first real trade you need to look inside yourself and get the answers. We can correct any deficiencies before they result in paralysis (not pulling the trigger) or a huge loss (overconfidence). A huge loss can prematurely end your trading career, or prolong your success until you can raise additional capital.
The difficulty doesn’t end with “pulling the trigger”. In fact what comes next is equally or perhaps more difficult. Once you are in the trade the next hurdle is staying in the trade. When trading foreign exchange you exit the trade as soon as possible after entry when it is not working. Most people who have been successful in non-trading ventures find this concept difficult to implement.
For example, real estate tycoons make their fortune riding out the bad times and selling during the boom periods. The problem with trying to adapt a 'hold on until it comes back' strategy in foreign exchange is that most of the time the currencies are in long-term persistent, directional trends and your equity will be wiped out before the currency comes back.
The other side of the coin is staying in a trade that is working. The most common pitfall is closing out a winning position without a valid reason. Once again, fear is the culprit. Your subconscious demons will be scaring you non-stop with questions like “what if news comes out and you wind up with a loss”. The reality is if news comes out in a currency that is going up, the news has a higher probability of being positive than negative (more on why that is so in a later article).
So your fear is just a baseless annoyance. Don’t try and fight the fear. Accept it. Have a laugh about it and then move on to the task at hand, which is determining an exit strategy based on actual price movement. As Garth says in Waynesworld “Live in the now man”. Worrying about what could be is irrational. Studying your chart and determining an objective exit point is reality based and rational.
Another common pitfall is closing a winning position because you are bored with it; its not moving. In Football, after a star running back breaks free for a 50-yard gain, he comes out of the game temporarily for a breather. When he reenters the game he is a serious threat to gain more yards – this is indisputable. So when your position takes a breather after a winning move, the next likely event is further gains – so why close it?
If you can be courageous under fire and strategically patient, foreign exchange trading may be for you. If you’re a natural gunslinger and reckless you will need to tone your act down a notch or two and we can help you make the necessary adjustments. If putting your money at risk makes you a nervous wreck its because you lack the knowledge base to be confident in your decision making.
Patience to Gain Knowledge through Study and Focus
Many new traders believe all you need to profitably trade foreign currencies are charts, technical indicators and a small bankroll. Most of them blow up (lose all their money) within a few weeks or months; some are initially successful and it takes as long as a year before they blow up. A tiny minority with good money management skills, patience, and a market niche go on to be successful traders. Armed with charts, technical indicators, and a small bankroll, the chance of succeeding is probably 500 to 1.
To increase your chances of success to near certainty requires knowledge; acquiring knowledge takes hard work, study, dedication and focus. Compile your knowledge base without taking any shortcuts, thereby assuring a solid foundation to build upon.

Stumble
Delicious
Technorati
Twitter
Digg
Facebook
Reddit

Enter your email address:

Delivered by Dollars Trade

Followers


Forex Special Copyright © 2010 Dollars Trade is Designed by Mian Asad Ali